For sixteen months, I checked my Instagram notifications like an addict hitting a broken slot machine.
Every time a Reel popped off with 500 likes, I convinced myself I cracked the algorithm. Then the next video hit 320 views. Total flatline. My graph looked like an erratic EKG monitor, and I had zero idea why one post reached 40,000 non-followers while the next died in the feed of my close friends.
The native Instagram Professional Dashboard is partly to blame. Meta designed those charts to keep you hooked on dopamine rather than giving you an engineering schematic of your distribution. They show you total impressions in giant purple fonts, but bury the retention curves three menus deep behind tiny gray arrows.
Once you figure out how the recommendation engine scores video watch sessions, the mystery evaporates.
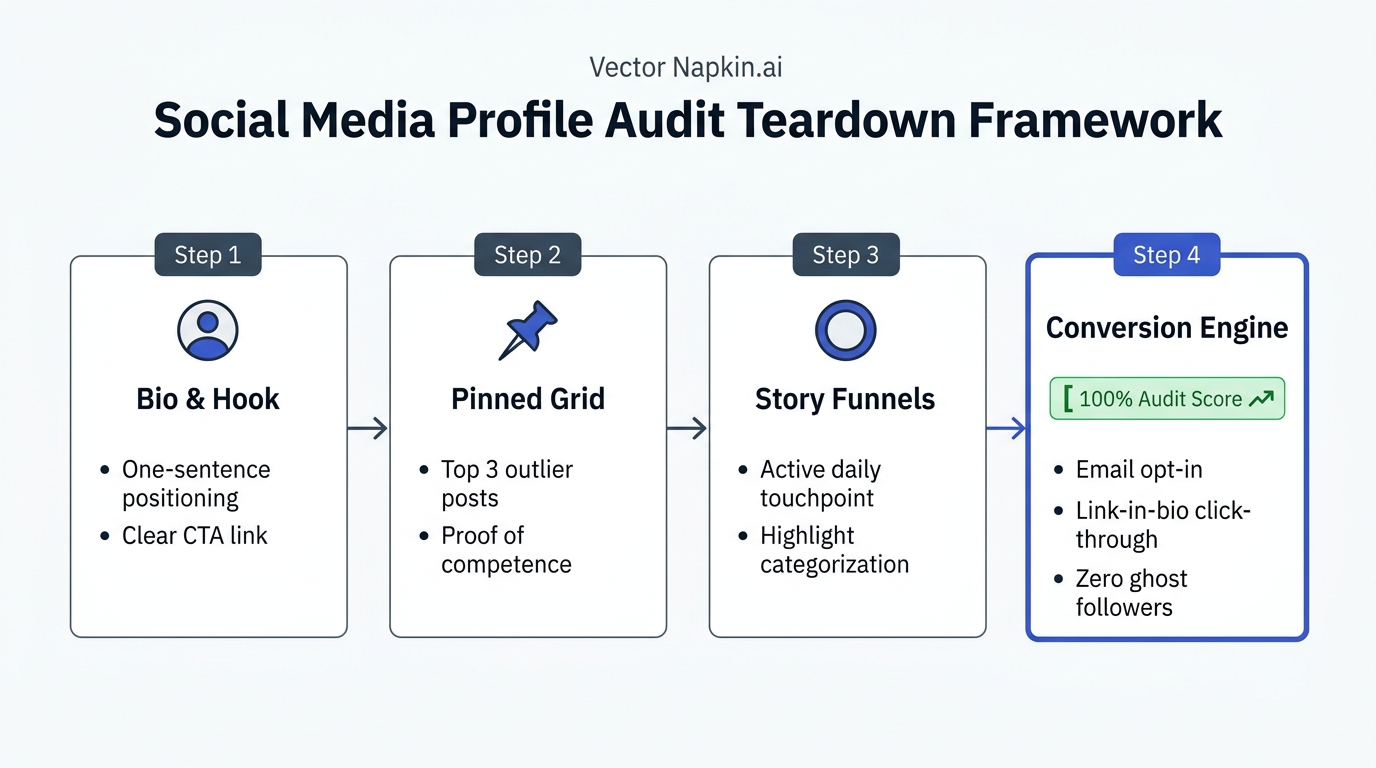
Here is the exact dashboard teardown I use every Sunday night to audit my accounts, diagnose reach drops, and decide what to film on Monday.
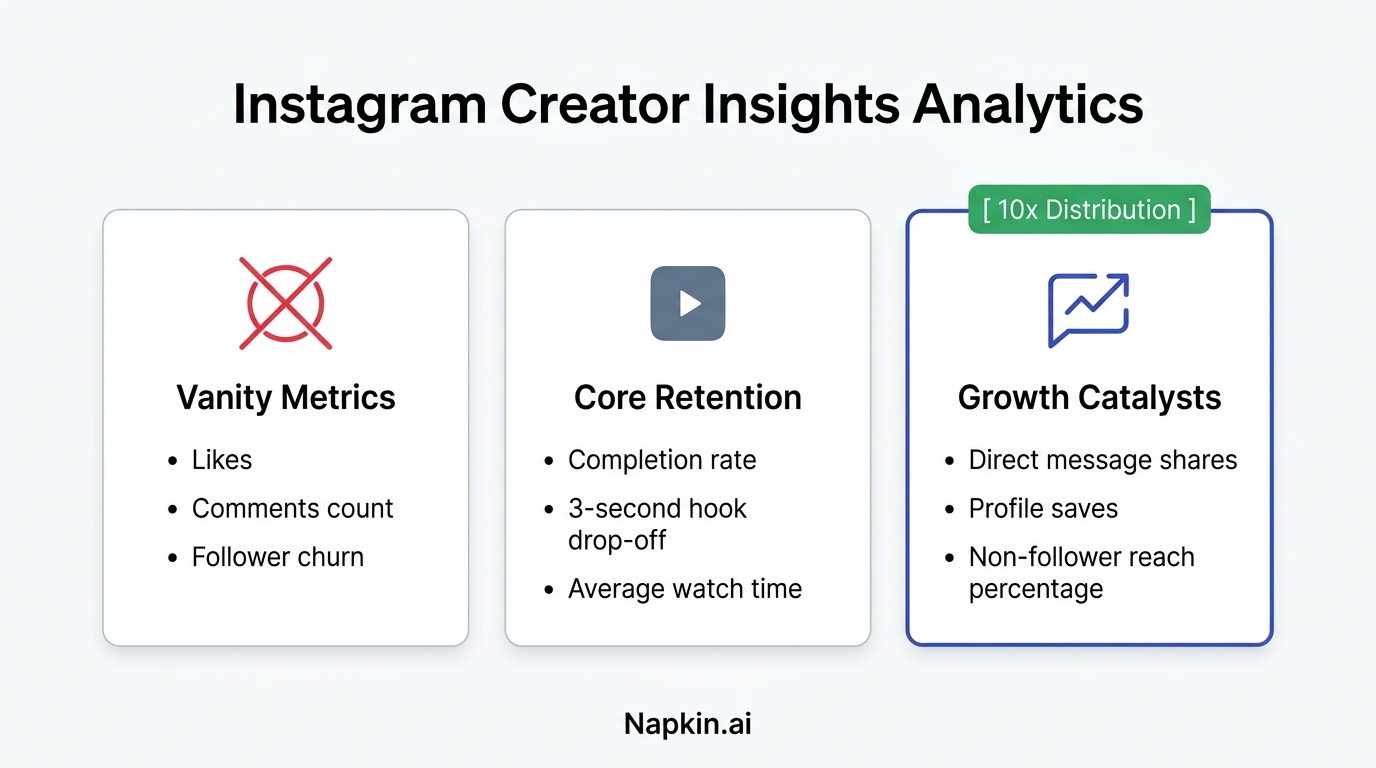
The Three Metrics That Actually Dictate Reach (And Three to Ignore)
Most creators look at the top-level numbers and draw completely backwards conclusions.
Instagram's engineering team has stated publicly that their recommendation ranking weights specific actions differently. When you tap into an individual post insight, here is the hierarchy that matters:
| Dashboard Metric | Weight in Recommendation Algorithm | Why Creators Misinterpret It | Actionable Benchmark |
|---|---|---|---|
| Direct Message (DM) Shares | Highest (Tier 1) | People think public comments matter more. Private sends trigger external app engagement. | > 3% of total view count |
| Saves / Bookmarks | High (Tier 2) | Viewed as vanity storage. Tells Meta the content carries lasting educational utility. | > 2% of total view count |
| Watch Time vs. Clip Length | High (Tier 2) | High view counts can still have terrible retention. 110% average watch time causes viral loops. | > 85% completion rate on 30s clips |
| Total Likes | Low (Tier 3) | A double-tap requires zero cognitive friction. Meta treats it as cheap passive signal. | Safe to ignore during audits |
| Profile Visits | Contextual | High views with zero profile visits means your hook worked but your brand hook failed. | > 1.5% profile conversion |
| Follower Unfollows | Noise | Creators panic over daily unfollows. High reach always accelerates natural churn. | Ignore unless unfollows spike 5x |
Why DM Shares Trump Every Other Signal
When someone taps the paper airplane icon and sends your Reel to a friend on WhatsApp or Instagram DMs, two things happen inside Meta's ranking system.
First, you generated a peer-to-peer recommendation with 100% human intent. Second, you brought another human being back into the Instagram app when they open that notification.
Instagram rewards content that causes inbound sessions. If your video gets 2,000 likes but only 14 shares, it dies. If it gets 150 likes and 480 shares, Meta pushes it into the Explore tab and Suggested Reels grid for non-followers.
Diagnosing The "Reach Cliff": Followers vs. Non-Followers
Open any Reel in your Professional Dashboard. Tap View Insights, scroll down past the bar charts, and look at the Reach module.
Look at the pie chart split: Followers vs. Non-Followers.
This single ratio tells you whether your post lived in your existing echo chamber or made it into the algorithmic discovery pool:
Healthy Viral Push:     [ 15% Followers ]  [ 85% Non-Followers ]
Stagnant Echo Chamber:  [ 92% Followers ]  [  8% Non-Followers ]
Algorithmic Penalty:    [ 98% Followers ]  [  2% Non-Followers ]
When your non-follower reach drops below 20% on three consecutive videos, you do not have an algorithm shadowban. You have a hook fatigue problem.
Your existing audience clicks because they know your face. Strangers scrolling at 120 frames per second on an iPhone screen swipe away within the first 1.4 seconds.
How to Audit the Hook Retention Curve
Instagram now provides the video retention graph directly inside the mobile app for Reels.
Go to your post insights, find Audience Retention, and study the line slope between second 0 and second 3.
Retention %
100% |-------\
 80% |        \_______ (Healthy: drops to 70% by sec 3, then stabilizes)
 60% |                \
 40% |                 \________ (Terminal Leak: drops to 35% by sec 2)
 20% |
  0% +---------------------------------
     0s    2s    4s    6s    8s   10s   Time
Three retention shapes show up across every creator account:
1. The Ski Slope (Terminal Hook Leak)
Your curve falls from 100% to 35% before second 2. You spent the first two seconds clearing your throat, saying "Hey guys", adjusting your microphone, or displaying a boring title card. The viewer left before hearing your premise.
2. The Flat Plateau (High Retention, Low Virality)
Retention stays high at 75% all the way through, but total views stay stuck at 1,500. This happens on niche tutorials. The people who stayed loved it, but nobody shared it because it lacked an emotional trigger or controversial payoff.
3. The Re-Watch Spike (Viral Loop)
The retention line dips slightly in the middle, then shoots above 100% near the end. This happens when you put dense visual data on screen, create a seamless audio loop, or deliver a punchline so fast the viewer replays the clip to catch what you said.
When you audit your past 30 days of posts with an automated scanner like Creator Insights Instagram Analyzer, look specifically for clips with high re-watch spikes. Those contain the exact pacing blueprints you need to clone for your next batch.
Calculating Your Account's Baseline Engagement Velocity
Do not evaluate posts in a vacuum. A Reel with 10,000 views is terrible for an account averaging 80,000 views, but massive for an account averaging 800 views.
Here is the exact formula I use to establish my monthly account baseline:
$$\text{Median Views} = \text{Middle value of your last 20 Reels (excluding top 2 and bottom 2)}$$
$$\text{Outlier Multiplier} = \frac{\text{Post Views}}{\text{Median Views}}$$
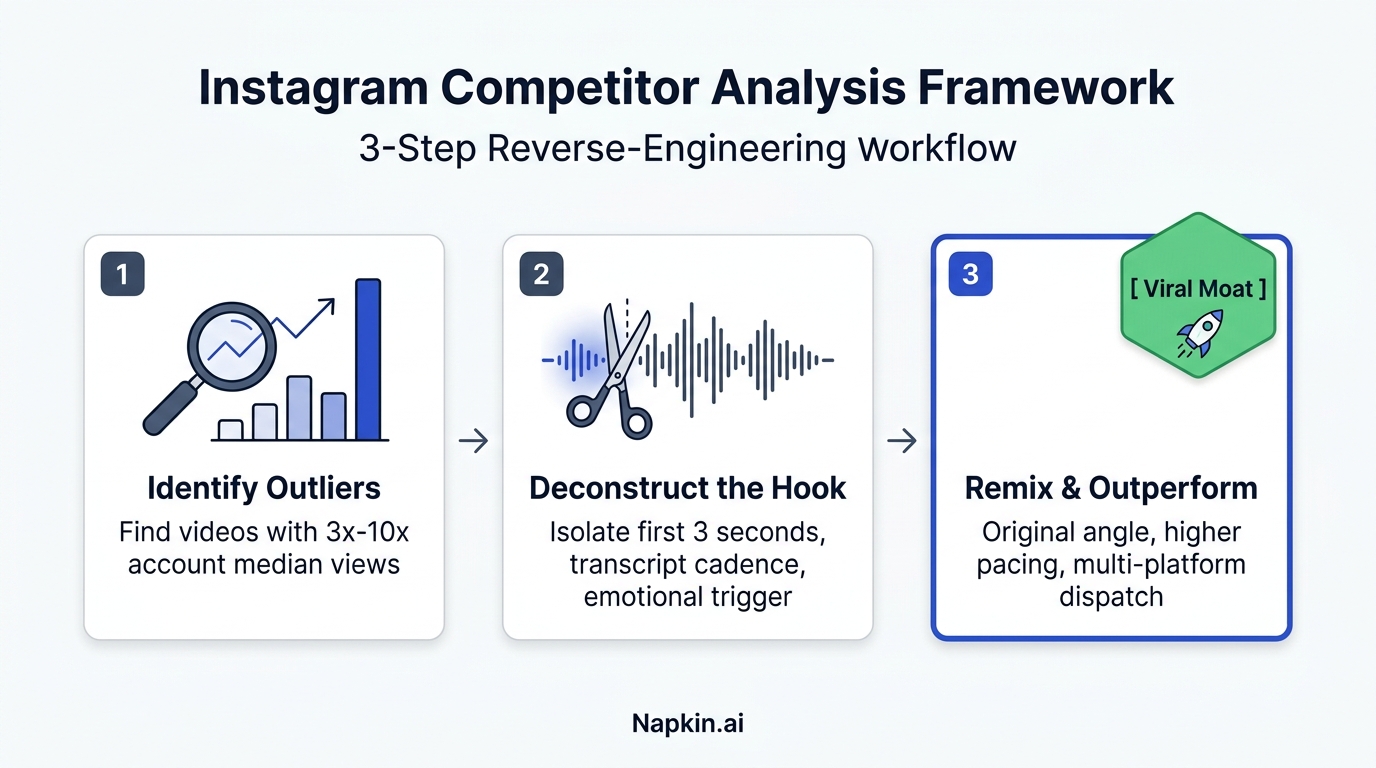
Any post with an Outlier Multiplier above 3.0x is an algorithmic outlier.
Instead of moving on to a brand new topic next week, double down immediately. Take that winning script angle, rebuild it with a slightly different visual hook, and post it again fourteen days later.
If you want to automate this process across your entire library without manually typing view counts into an Excel sheet, check out our guide on The Outlier Method for Content Detection or run a instant scan with our Content Audit Tool.
4 Concrete Changes to Make in Your Next Video
- Delete the first 1.5 seconds of your edit. Cut the breath before you speak. Start mid-syllable or mid-action.
- Add a share trigger in the caption. End with: "Send this to whoever is still looking at likes in 2026." Give viewers a direct social reason to forward the video.
- Use the 3-second visual reset. Switch camera angles, drop on-screen text, or change B-roll every 2.8 seconds to interrupt scrolling trance.
- Track weekly ratios, not daily spikes. Check your Professional Dashboard once every seven days on desktop. Log your follower vs. non-follower percentage and spot trends over 30-day windows.