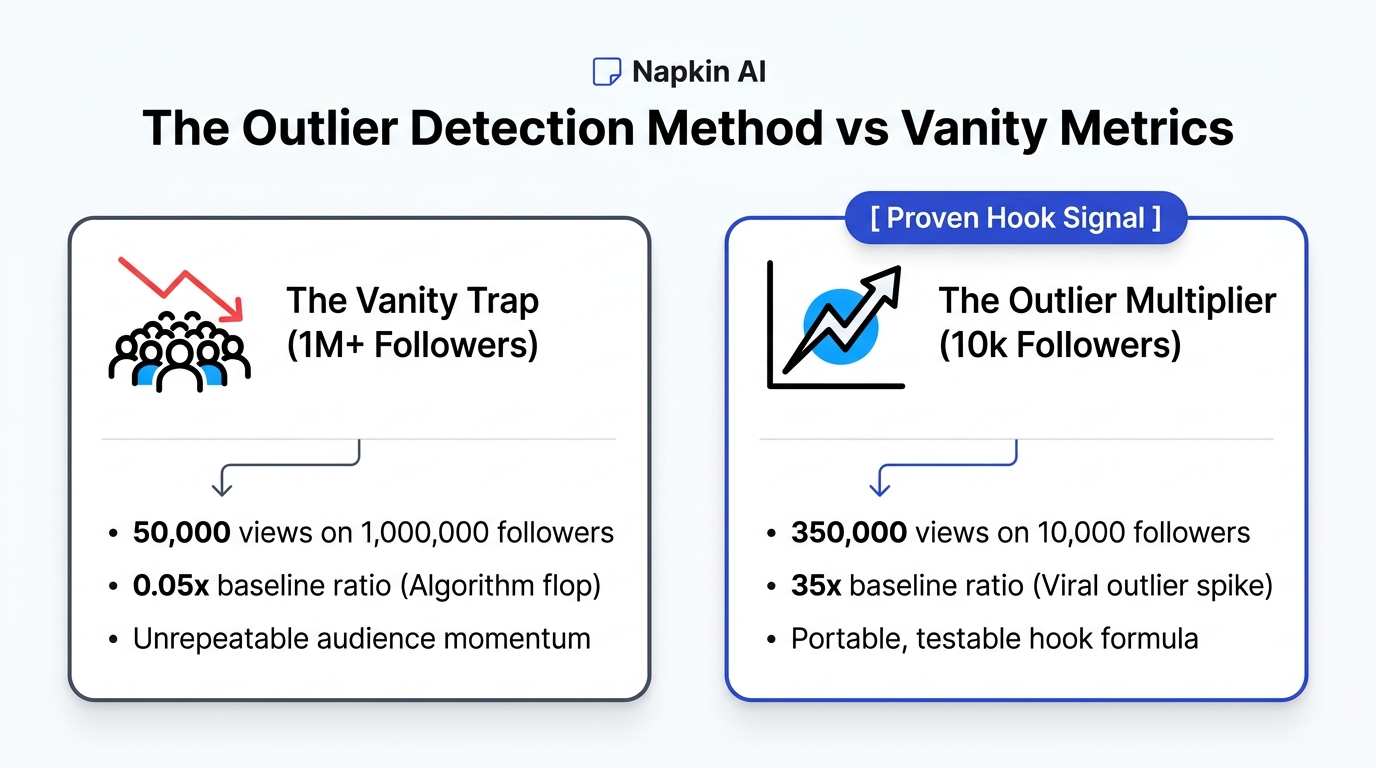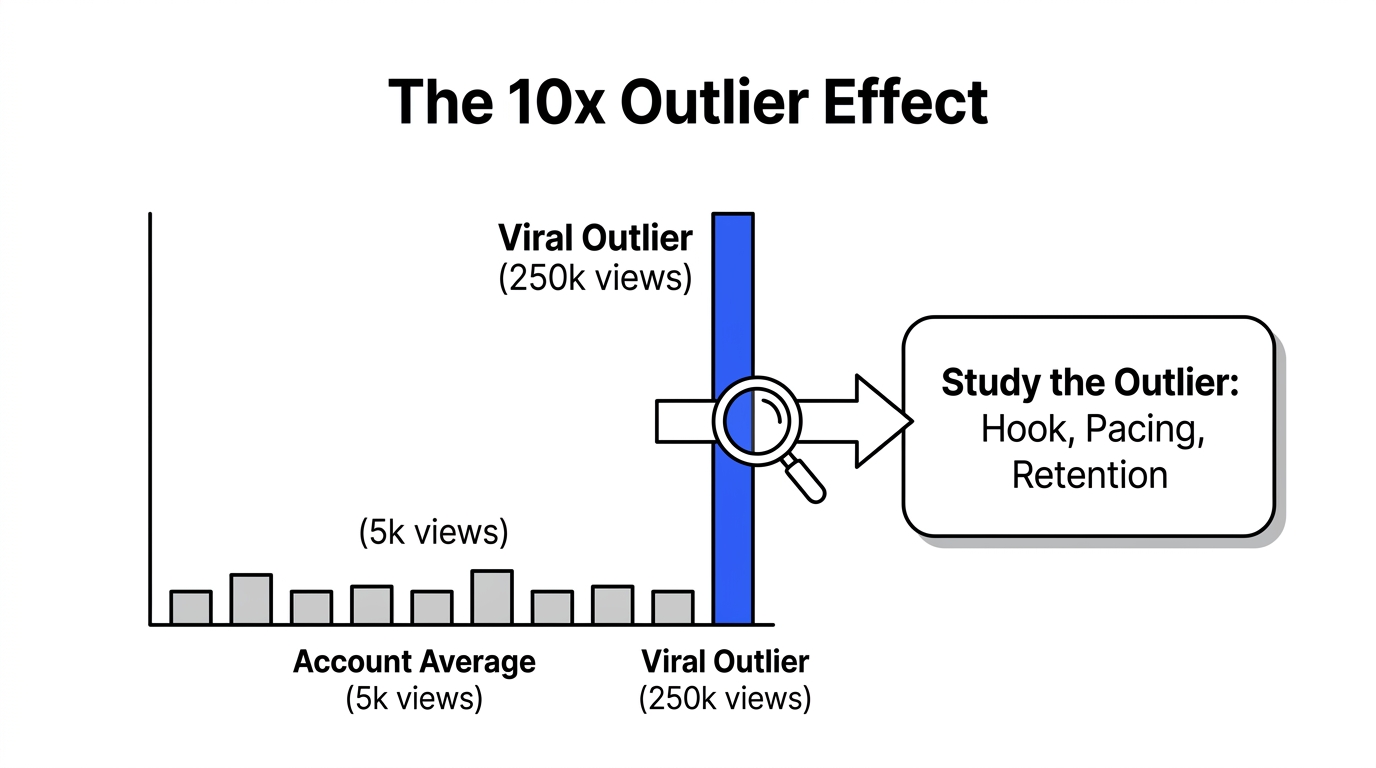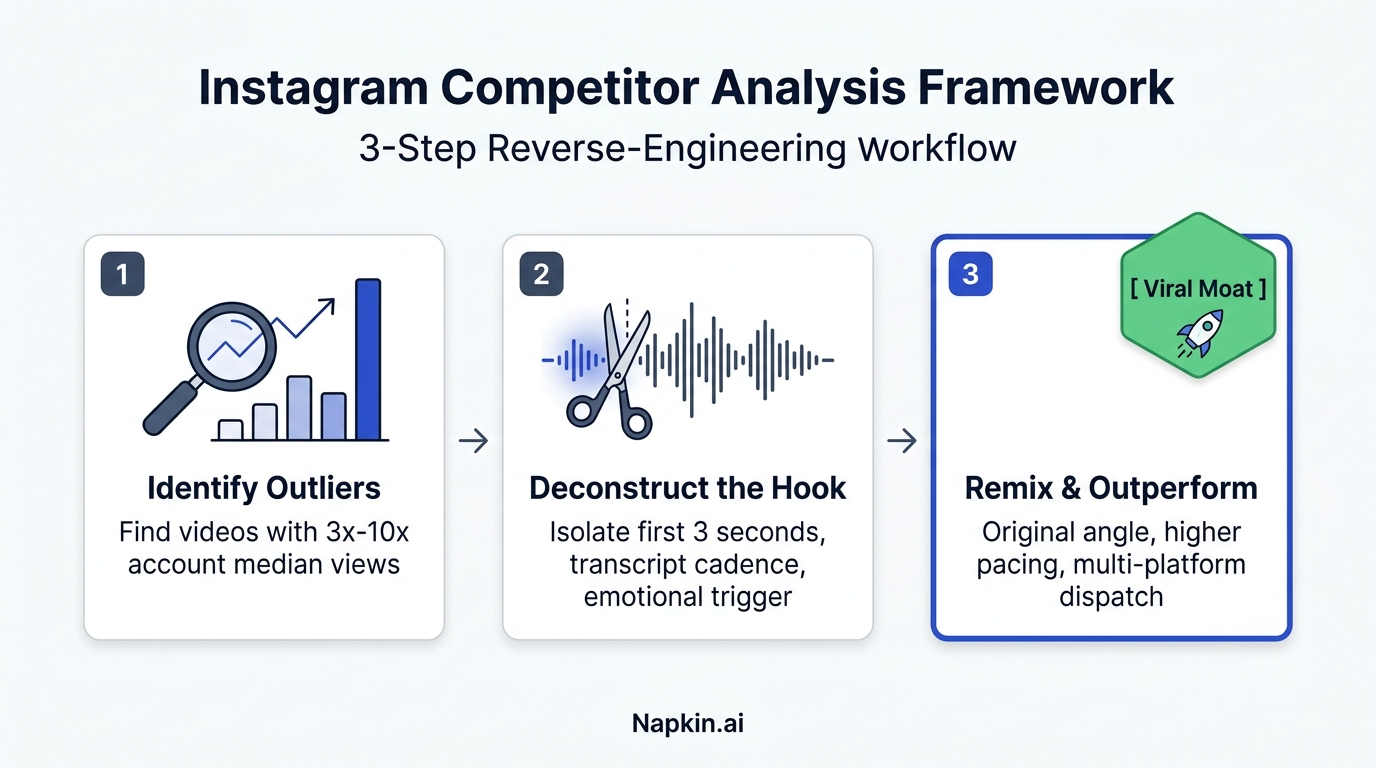
Analyzing competitor Instagram Reels requires calculating the outlier ratio against an account's median baseline rather than trusting raw vanity view counts. A Reel generating 200,000 views on an account averaging 500,000 is an algorithmic failure, whereas that same 200,000 views on an account averaging 8,000 represents a true 25x viral outlier that reveals proven audience demand.
Most creators approach competitor research completely backward.
They open the Instagram mobile app, tap a competitor's profile grid, scroll for ten seconds, and click on whichever thumbnail has an impressive number underneath it. Then they try copying the exact sound or dancing along to the same beat.
Two days later, their replica gets 340 views.
You cannot reverse-engineer organic reach by looking at cosmetic metrics. Big accounts get hundreds of thousands of views simply because their historical follower graph acts as an algorithmic safety net. If you run a small channel with under 10,000 followers, mimicking an established celebrity creator will fail almost every single time.
To pull actionable ideas from your rivals, you must run mathematical competitor audits.
Here is the exact step-by-step diagnostic framework top digital agencies use to deconstruct competitor Reels, measure real engagement velocity, and uncover winning hooks before recording.
The Outlier Factor Equation: Isolating Real Viral Signal
The outlier factor isolates video performance from account follower size by dividing individual video views by the account's 30-day median baseline view count.
$$\text{Outlier Factor} = \frac{\text{Specific Video Views}}{\text{Account 30-Day Median Views}}$$
Raw view totals tell you how large an account is; the outlier multiplier tells you how compelling the specific topic was to non-followers.
When auditing competitors using the Creator Insights Instagram Analyzer, we categorize every published video into four distinct statistical tiers:
| Performance Tier | Outlier Multiplier | Algorithmic Distribution Mechanism | Creative Action |
|---|---|---|---|
| Baseline Feed | $0.5\times - 1.2\times$ | Distributed strictly to core existing followers | Ignore for content modeling |
| Above Average | $1.3\times - 2.5\times$ | Pushed into secondary Explore and Interest tabs | Note topic for editorial rotation |
| Breakout Outlier | $2.6\times - 5.0\times$ | Tested on cold FYP feeds and search queries | Deconstruct hook, script, and pacing |
| Mega Viral Hit | $> 5.0\times$ | Uncapped external recommendation velocity | Re-angle core premise for your audience |
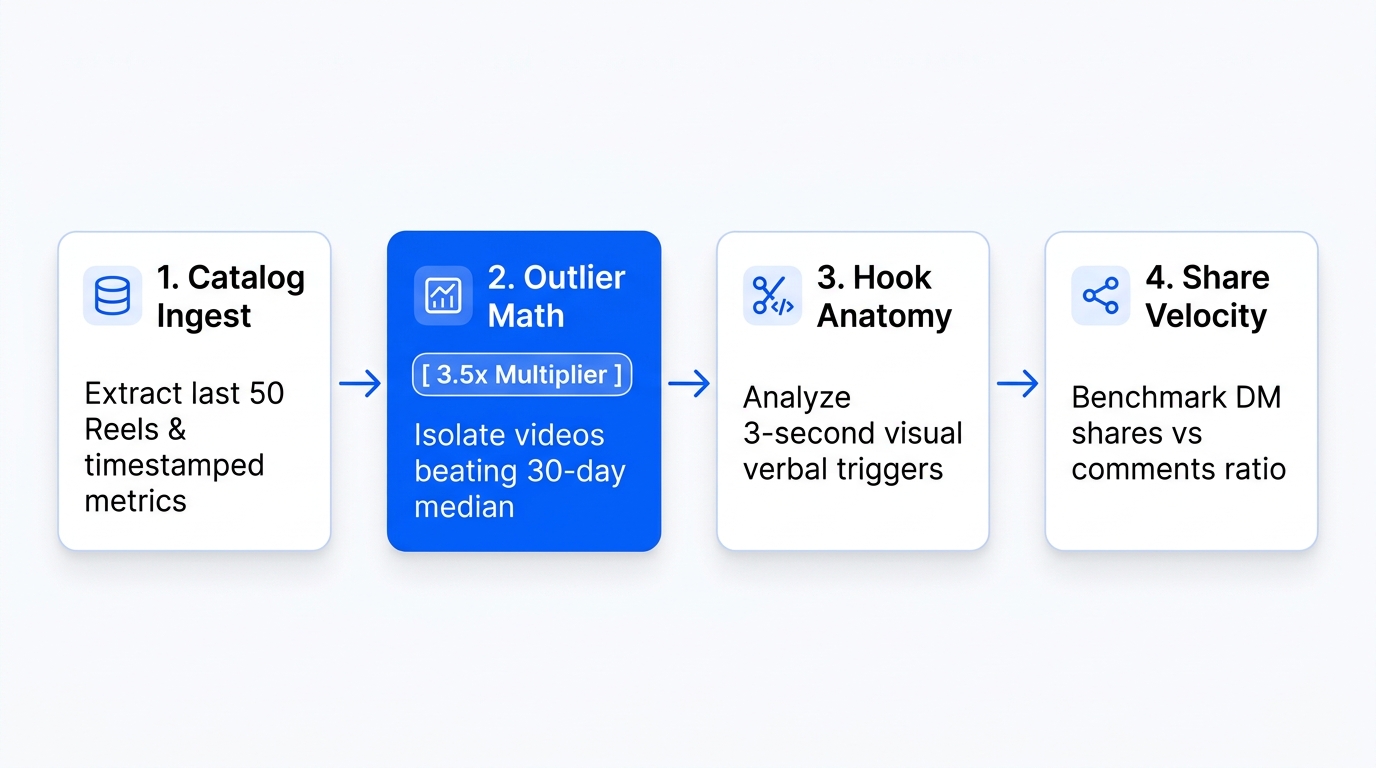
Look for accounts with under 25,000 followers producing videos scoring above $3.5\times$. When a creator with tiny audience equity explodes into six-figure views, the algorithm is rewarding pure viewer retention and share mechanics, not existing brand fame.
Deconstructing the Reel: The 4-Part Teardown
Once you identify an outlier Reel scoring above $3.5\times$, run it through a systematic 4-part anatomical breakdown.
1. The 3-Second Visual and Verbal Anchor
Watch only the first three seconds on mute. What physical action happens on screen? Did the creator cut immediately to a high-contrast demonstration, drop a surprising stat overlay, or point at a bizarre visual discrepancy? Next, turn audio on. Did they lead with a direct value promise or an open curiosity loop? Note down the exact phrasing of their first twelve spoken words.
2. Spoken Pacing and Cut Frequency
Run a stopwatch across the first fifteen seconds. Count every single cut, zoom, text pop, and sound effect. High-retention Reels consistently hit a cut cadence of one visual shift every 1.8 to 2.4 seconds. If a competitor held viewer attention for 45 seconds straight without complex edits, pay obsessive attention to their spoken storytelling structure.
3. Comment Sentiment and Audience Gaps
Never stop at reading the caption. Scroll straight into the comment section. Look for recurring confusion, follow-up questions, and emotional pushback. When twenty commenters ask, "Where did you find that setting?" or "Does this work for small teams?", they just handed you the script for your next three follow-up videos.
4. Direct Message (DM) Share Velocity
Instagram chief Adam Mosseri has explicitly stated that sends per reach (how many people share a Reel via direct message to a friend) is the single most powerful ranking signal on the platform. Comments are nice; DM shares create exponential distribution loops. Look for content that solves a specific private pain point or sparks an inside joke that viewers feel compelled to send directly to colleagues.
2026 Instagram Reels Algorithmic Benchmarks
Evaluating whether a competitor's post truly succeeded requires comparing engagement against modern algorithmic thresholds.
| Metric | Weak Performance | Average Benchmark | Top 5% Outlier Signal |
|---|---|---|---|
| 3-Second Hook Retention | $< 45%$ | $55% - 65%$ | $> 75%$ of viewers remain |
| Average Percentage Watched (APW) | $< 60%$ | $75% - 85%$ | $> 100%$ (watched on loop) |
| DM Share to Like Ratio | $1 : 20$ | $1 : 8$ | $1 : 2$ (shares rival likes) |
| Save Rate | $< 1%$ of views | $2% - 4%$ of views | $> 6%$ (high reference value) |
When you analyze competitor accounts inside our Competitor Intelligence Suite, you see these underlying ratios clearly instead of guessing from public comment counters.
Frequently Asked Questions
How do I calculate a competitor's real engagement rate on Instagram Reels?
Calculate true Reels engagement rate by taking the sum of likes, comments, and saves, dividing that number by total video views, and multiplying by 100. Calculating engagement against follower count is misleading on Reels because recommendation algorithms push short-form video predominantly to non-followers across cold explore feeds.
Why do some Reels with low likes get millions of views?
High-view Reels with low public like counts are driven by private Direct Message share velocity and high watch time completion rates. The Instagram algorithm prioritizes content that users forward privately to friends and watch repeatedly, even if viewers do not tap the heart icon on their feed.
How many competitor Reels should I analyze before scripting my own?
Audit at least 30 to 50 recent Reels across 5 to 10 direct competitors in your sub-niche. This volume provides a statistically significant baseline to distinguish consistent performers from lucky one-off flukes and reveals the exact recurring formats your shared audience engages with most.
What is the ideal video duration for high-ranking Instagram Reels?
Short-form Reels between 7 and 15 seconds consistently achieve the highest completion rates (often exceeding 100% due to auto-replay loops). However, educational authority Reels between 45 and 70 seconds generate substantially higher save rates and DM share velocity when scripted with tight visual transitions.
How does Creator Insights extract competitor video metrics automatically?
Creator Insights connects directly to platform public metrics to pull view counts, upload dates, caption text, and engagement velocity for any public profile. The platform highlights outlier videos mathematically, isolates winning structural patterns, and organizes top-performing hooks into a searchable creator dashboard.