Most brands are social media archeologists. They spend their days digging through the remains of trends that died three weeks ago. By the time a "trending" audio hits a corporate marketing meeting, it's already over. The Gen Z interns have moved on, the engagement has peaked, and your brand looks like it’s wearing socks with sandals at a beach party.
If you want ROI, you can't be a follower. You have to be an early adopter.
Tracking trends isn't just about knowing what music is popular. It’s about understanding the shift in consumer sentiment before it becomes a hashtag. For a brand, the right Instagram trend tracker is the difference between a post that gets "pity likes" from employees and a campaign that drives a 1,448% ROI: a number we’ve seen brands hit when they master Reels content at the right moment.
The "Late-to-the-Party" Tax
Every day you wait to jump on a trend, your potential reach decays. We call this the Late-to-the-Party Tax.
When a trend is in its "Alpha" phase (the first 48 hours), the algorithm is hungry. It’s looking for content to categorize the trend. If you post then, you get the "Early Adopter Bonus": massive organic reach for a fraction of your usual ad spend.
By the "Beta" phase (day 3 to 7), the market is saturated. You’re competing with everyone else who saw it on their "Explore" page. Your ROI drops. The cost of attention goes up.

Napkin Visual: A line graph showing "Attention Value" on the Y-axis and "Time" on the X-axis. A sharp spike occurs in the first 48 hours labeled "Alpha Phase/High ROI," followed by a steep drop-off labeled "Saturated/Late-to-the-Party Tax."
Why Generic Tracking Fails
Most "trend" lists you find online are useless for brands. Why? Because they are too broad. Knowing that a Taylor Swift song is trending doesn't help a B2B SaaS company or a boutique skincare line.
You need niche-specific intel. You need to know what your competitors are doing and what your specific audience is reacting to. A real Instagram trend tracker for brands doesn't just give you a list; it gives you a roadmap.
It’s about spotting patterns. If three of your top competitors suddenly switch from high-production video to "lo-fi" phone footage, that’s not a coincidence. That’s a trend shift. If you aren't tracking that performance shift, you’re flying blind.
The ROI of Being First
Let’s talk numbers. Why does this matter for your bottom line?
- Lower CAC: Organic viral reach means you don't have to pay Mark Zuckerberg as much to find new customers.
- Brand Relevance: Being first makes you look like a leader, not a copier.
- Higher Conversion: Trends often revolve around specific problems or "relatable moments." Tapping into these creates an instant emotional bond with the viewer.
But how do you actually do it without spending 8 hours a day scrolling?

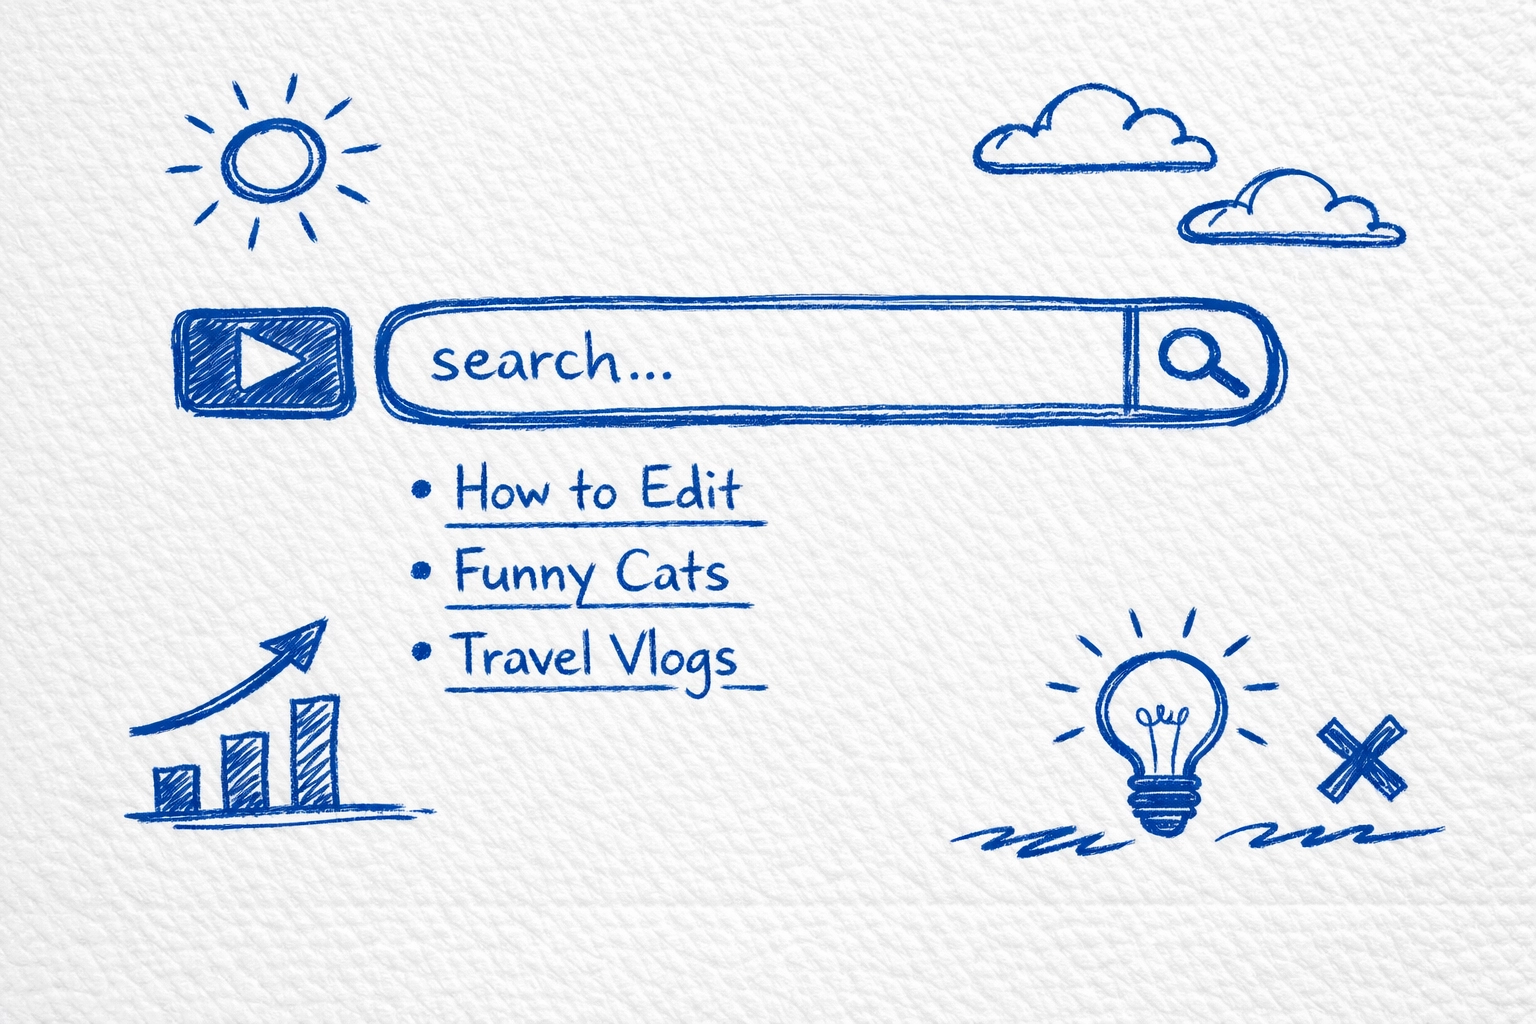
Napkin Visual: A simple flow chart. Step 1: Detect Trend -> Step 2: Analyze Competitor Performance -> Step 3: Rapid Execution -> Step 4: ROI Audit.
How to do it with Creator Insights
We didn't build a tool just to show you pretty graphs. We built a workflow to help you execute. Here is how you use Creator Insights as your secret weapon.
Step 1: The Canvas Board (The Collection Phase)
Stop taking screenshots that get lost in your camera roll. Use our Canvas Board to collect trending posts from competitors and influencers in one central place.
Think of it as a digital war room. When you see something working: whether it’s a specific caption style, a hook, or a visual transition: drop it onto the board. This allows your team to see the "visual vibe" of your niche in real-time.
Step 2: The Chrome Extension (The Action Phase)
This is where the magic happens. While you are browsing Instagram on your desktop, our Chrome Extension acts as your real-time analyst.
With one click, you can:
- Tag posts for specific campaigns.
- Track performance shifts (Is this post over-performing the account's average?).
- See the "Alpha" data before the trend goes mainstream.
If a competitor’s post is getting 5x their usual engagement, the extension flags it. That is your signal to move.
Step 3: The Web Dashboard (The Global View)
Once you've collected data, head to the Web Dashboard. This gives you the "Bird’s Eye View."
You aren't just looking at one post anymore; you’re looking at niche-wide shifts. Are carousels outperforming Reels this week? Is a specific keyword driving more "Saves"? The dashboard tells you where to put your creative energy so you aren't wasting time on content that won't move the needle.

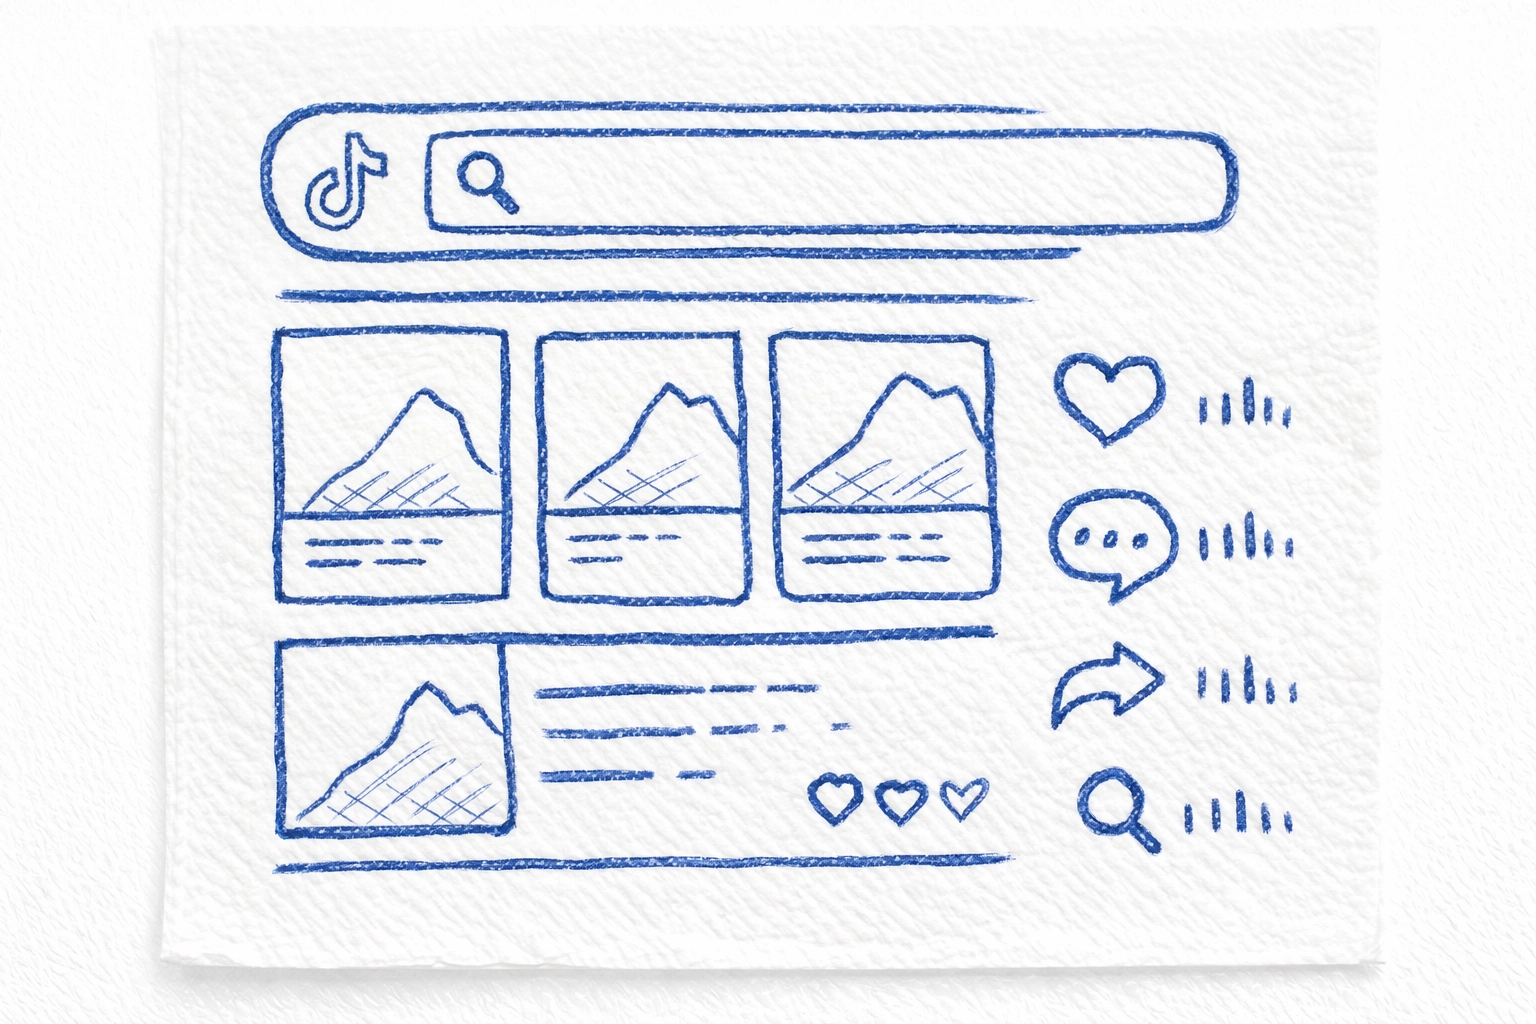
Napkin Visual: A split screen. On the left, a cluttered "Saved" folder on Instagram labeled "The Old Way (Chaos)." On the right, the Creator Insights Dashboard with organized tags and performance metrics labeled "The ROI Way (Clarity)."
Gritty Scenario: The Friday Afternoon Pivot
It’s Friday at 3:00 PM. Your team has a "safe" educational post scheduled for Monday.
Suddenly, your Instagram trend tracker for brands (the Chrome Extension) pings you. A key influencer in your space just dropped a video using a new "Day in the Life" format that is getting massive "Share" numbers.
The Old Way: You see it, think "That’s cool," and go home. By Monday, 50 other brands have done it. You’re late.
The Creator Insights Way:
- You tag the post in the Extension.
- Your scriptwriter uses the Script Generator to adapt the hook for your brand.
- You film a quick version in 20 minutes.
- You post it Saturday morning.
- By Monday, you’ve gained 500 new followers and 20 attributed leads because you caught the wave at the peak.
That’s how you drive ROI.
The Performance Audit: Proving it Works
Strategy without measurement is just a hobby. You need to prove to the higher-ups (or yourself) that tracking these trends actually works.
Use the Audit Tool to run a deep dive on your own account after a "Trend Sprint." Compare your trend-focused posts against your "business as usual" content. Look at the reach, the engagement rate, and: most importantly: the conversion.

Napkin Visual: A magnifying glass hovering over an Instagram profile icon. Inside the glass are green "up" arrows and dollar signs, representing the audit process revealing hidden growth.
Stop Guessing, Start Tracking
The "algorithm" isn't a mystery; it’s a reflection of human behavior. Trends are just signals of what people care about right now.
If you’re tired of feeling like you’re always one step behind, it’s time to upgrade your toolkit. Stop manual scrolling. Start using a system designed for growth.
Ready to see what’s actually trending in your niche?
- Analyze your competitors: Start an Audit
- Track trends while you browse: Get the Chrome Extension
- Find your next big hit: Explore Discovery
Don't wait until the trend is dead. By then, the ROI has already left the building.

Napkin Visual: A surfboard leaning against a wall with the "Creator Insights" logo. The caption reads: "Don't just watch the waves. Ride them."
Join the brands that are leading the conversation. Visit Creator Insights and take control of your Instagram strategy today.